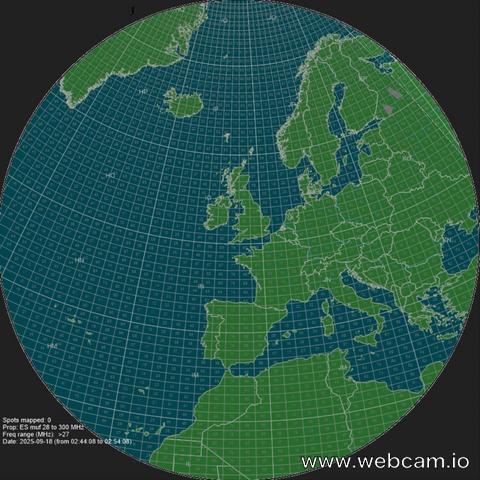
NOTE: Due to restrictions on the number of images on this free account I'm only running the timelapse between 03h and 23h UT. A new frame is added every 5 minutes. The maps are generated by the application LiveMUF by Dave Edwards, G7RAU. This application is available to licenced radio amateurs to produce their own propagation maps. Static maps can be found on my website https://www.tvcomm.co.uk/g7izu KEY: Coloured lines indicate sporadic-E propagation reported in the following frequency bands during the last 10 minute period: Yellow lines = 28 MHz Light orange lines = 50 MHz Orange lines = 70 MHz Brown lines = FMBand 2 (87-108 MHz) Red lines = 144 MHz No-lines visible = No propagation reported White parallel lines crossing the map = day/night terminator Yellow star = Sub-solar point The calculated MUF is also shown on the map. When propagation is present and reported, coloured rectangles at the mid-points of the contact lines indicate the MUF in those squares in MHz as calculated by the Live MUF application for contacts during the last 10 minutes. The square colouring is scaled between yellow and red (28 MHz to 200 MHz). The data block in the bottom left corner includes the date and the start/end times for the 10 minute period of the current map in UTC.